Home Monitoring
This is the docker-compose stack I use for my home network’s monitoring. It contains the following containers:
- NGINX SSL termination for InfluxDB and Grafana traffic outside of Docker containers.
- InfluxDB to store all of the metrics (the central piece of the setup).
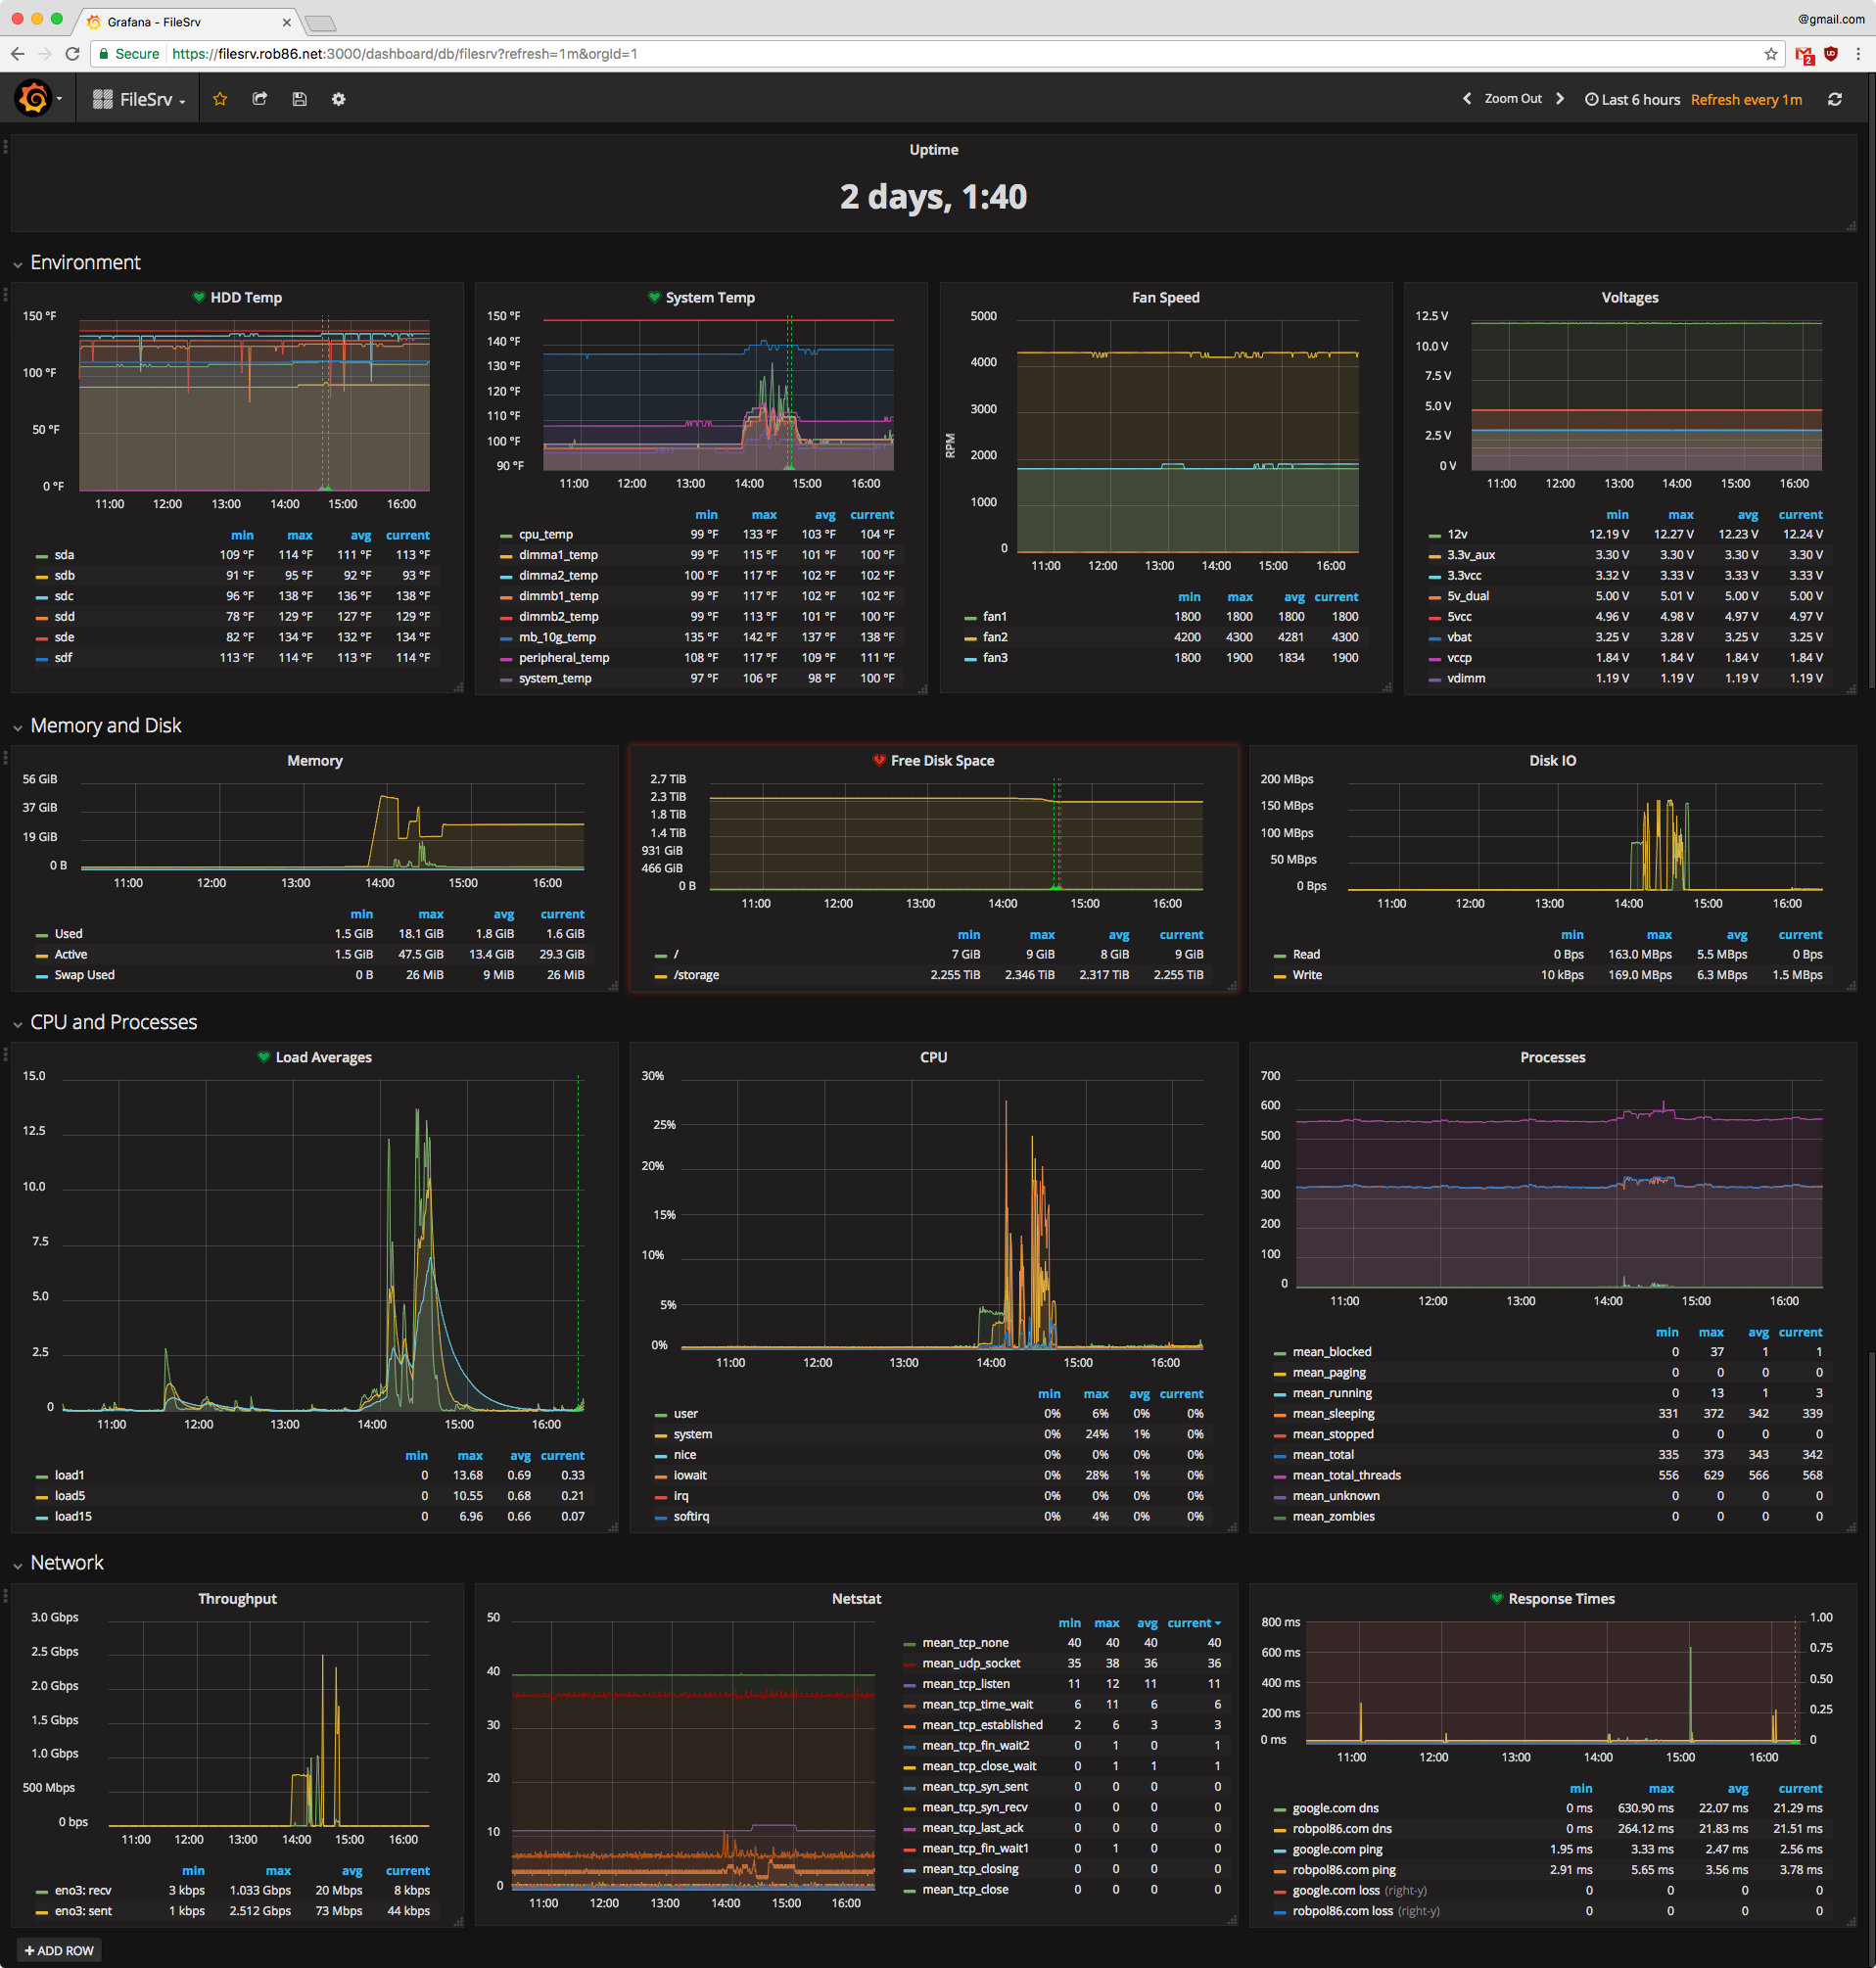
- Grafana to show pretty graphs and email me alerts.
- Cronitor for external monitoring of my Docker host and home network.
- NMC to include my UPS load, remaining runtime, and bedroom/living room temperatures in my Grafana graphs.
I also use the following services:
- SparkPost free tier for sending alerts emails.
This website is my brain dump on how I got monitoring and alerting setup on my home server from scratch. If you plan on using it for your server you’ll need to be on the lookout for my hostnames and IP addresses and substitute them with your own.